The "var_mode" and "var_profile" are applied by adding either ?var_mode=... (e.g. -section-title-?var_mode=...), or &var_mode=... (ex: spip.php?article3&var_mode=...) to the end of the URL for the called page.
Their application will only work if you are logged in to the site as one of the administrators.
var_mode=calcul and var_mode=recalcul
Calling a page with "var_mode=calcul" regenerates the HTML code (calls the already compiled code) and refreshes the cache (creates the HTML files which will simply need to be read when the next call to that page is requested).
Calling a page with "var_mode=recalcul" regenerates the PHP code (performs a new compilation of the template), then also regenerates the HTML code (run an execution of the code which has just been compiled) and then again finally refreshes the cache (creates the HTML files which will be read the next time that page is called).
the recalculation of the page also regenerates the compressed CSS and JavaScript scripts.
the recalculation does not apply to the images (vignettes/thumbnails, images-typo/textual images, ...)
Either of these two calls can be executed by clicking on one of the administration buttons visible on the public page whenever you are logged in as an administrator;

the first click calling "var_mode=calcul" (when the button’s title is accompanied with an asterisk, it is because the displayed page has been read from the cache);

a second click calls for a recalculation with "var_mode=recalcul".
Warning: You might be tempted to use&var_mode=recalculfor links inside your templates (to force an update to CSS or JavaScript content for example). This is a very bad practice that you should avoid since it consumes considerable server resources (causes constant re-compilation of the template).
var_mode=images
Calling "var_mode=images" recalculates the images and thumbnails generated by the graphic filters in the current page.
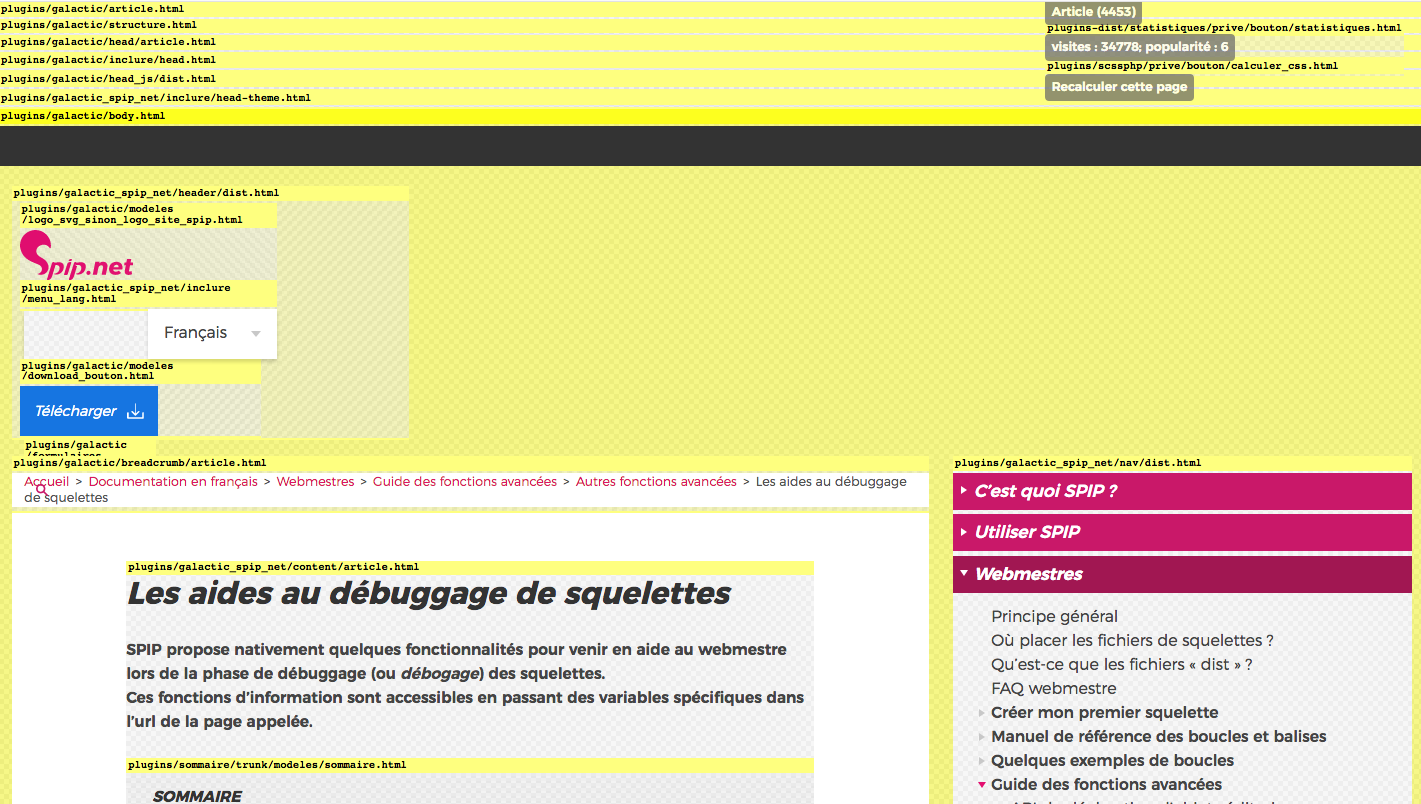
var_mode=inclure
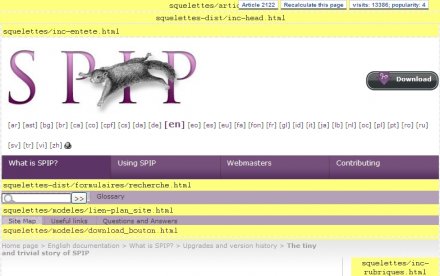
Calling a page with "var_mode=inclure" displays the name and path of each sub-component (inclure/include code or SPIP model) which is included within the page.
This makes it possible to check that the includes actually called by the page template are indeed those that have been specified, particularly important if you have overloaded any standard or plugin models by showing the full pathname to each included file.
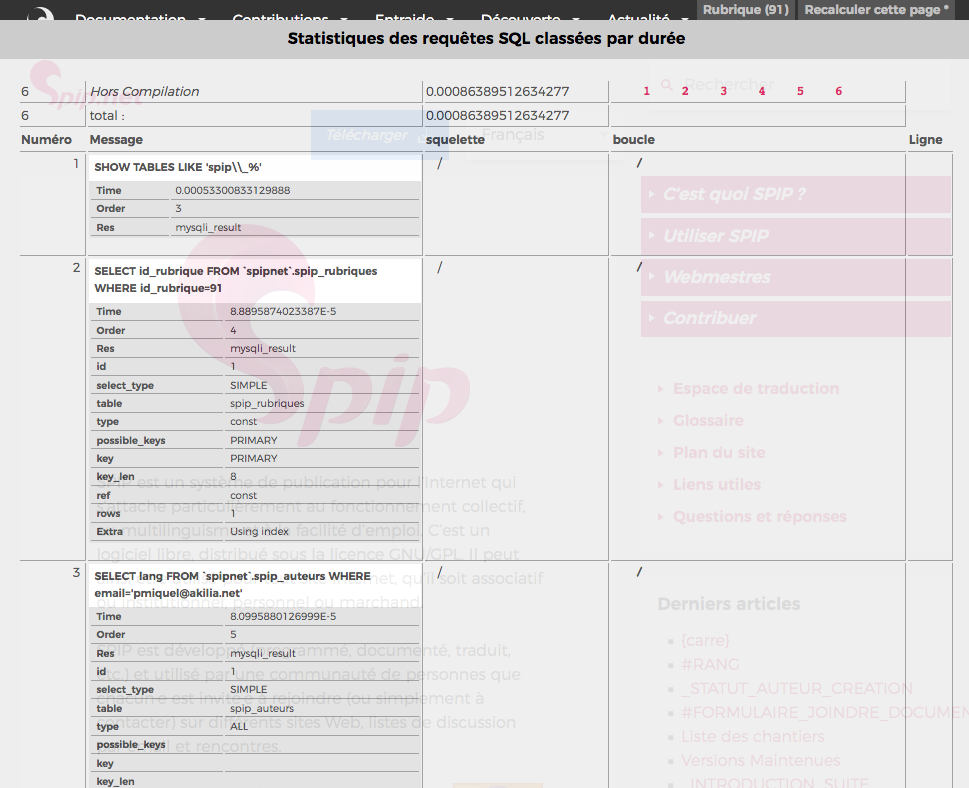
var_profile=1
Calling a page with "var_profile=1" displays the details of the SQL queries and the calculation times involved with each of them. The queries are sorted from the most time consuming to the least.
This function is particularly useful to find out what could be making a particular page display excessively slowly.
It allows you to view the SQL queries generated by each loop in the template (including those of any included templates or models) as well as any out of loop queries (noted as "Uncompiled") when generated by SPIP.

This will display:
- for each loop
- the number of times that the loop (and therefore the SQL query) has been executed,
- the time (in seconds) used by the loop (i.e. the time for the corresponding query multiplied by the number of executions of the loop),
- the list (sorted in chronological order of all the queries generated by the page) of each execution of the query (which provides a link to the details of each query).
- the uncompiled queries
- the total time taken by all of the queries for the page
- the details of each query run with
- a statistical table showing the execution plan of the query,
- the title of the query.
Caution:
var_profile will give different results depending on whether you request the page calculation or not.
- Remember to request the page calculation (&var_profile=1&var_mode=calcul) to get the results associated with the calculation of the whole page and its inclusions.
- If you don’t ask for the calculation, you will get far fewer results, as the HTML provided is from the cached results, without querying the DB. You will, however, see queries that remain active for all pages served, even when no calculation is required.
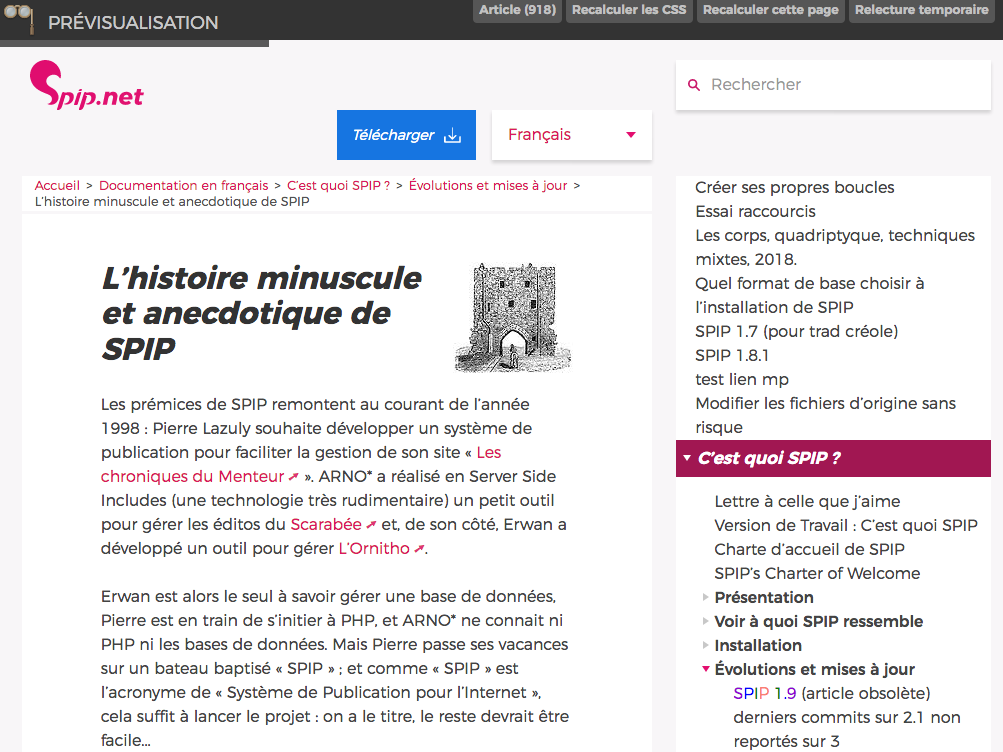
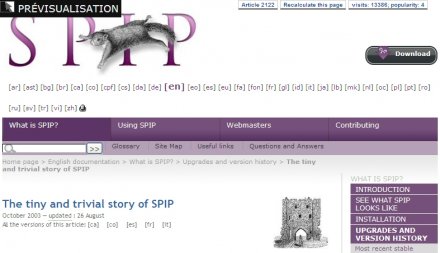
var_mode=preview
Calling a page with "var_mode=preview" from the private space is used to view an article which has been "proposed for publication" without actually needing to publish it on the public site.
var_mode=urls
Calling a page with "var_mode=urls" forces an update of all of the URLs included within that page.
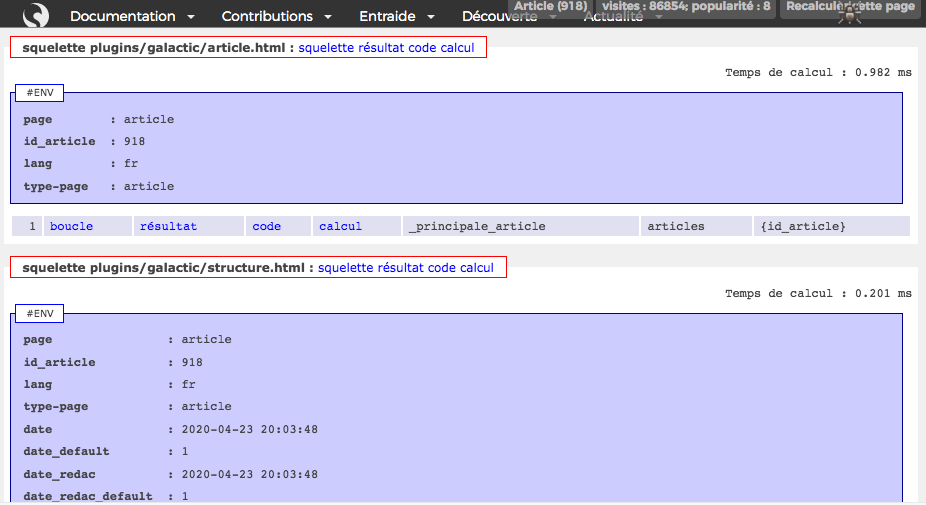
var_mode=debug
Calling a page with "var_mode=debug" details the generation of a page (the SPIP loops - SQL queries - PHP code - SQL query statistics).
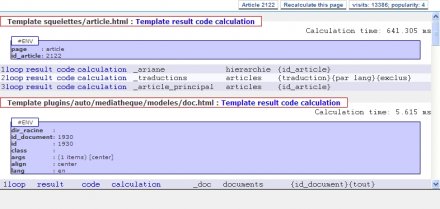
This page displays info for the main template file as well as for any included template files:
- the list of values of the environment context variables (#ENV) passed by the calling template,
- the list of loops.
The various links can be used to access:
- Template
the textual code of the template (thereby avoids needing to have direct access to the .html file in order to read its contents),- results
the code specifically generated by the template (any possible includes) which, once evaluated, will return the HTML to the browser, - code
the PHP code generated by the compiler (an analysis moreover intended for core code developers) which, once executed, will generate the results (see above), - calcul
the detail of the SQL queries and, for each of them, their execution times (see above forvar_profile).
- results
- boucle
the textual code of the complete loop (from<B_abc>through to<//B_abc>),- results
the SQL query generated by the loop in question,
a list of the first results returned by that query [1], - code
the PHP code (generated by the compiler) for the specific function associated with that loop (an analysis mostly reserved for expert core code developers), - calcul
the details and calculation time for the SQL query associated with that loop (see above forvar_profile).
- results
var_mode=traduction
The var_mode=traduction parameter is used to parse the language strings used in a page. When used, the language strings present in the page are highlighted:
- the translated language strings are highlighted, an info bubble giving the source item and the translation language is displayed when you hover on the chain,
- nonexistent language strings flash red.
Unlock SVP
There are 2 var_modes that can be used in SVP (on the plugin admin page):
- var_mode=vider_paquets_locaux tells SVP to force a recalculation of its information in base for what concerns local plugins (plugins/ , plugins-dist/).
- var_mode=reinstaller_svp is even more drastic: it uninstalls SVP (it will reinstall itself next time).
So, if it’s a problem with SVP reading, the first one should fix it (it used to happen in rare cases, but normally we shouldn’t need it anymore). The second one obviously requires SVP to be reconfigured afterwards (plugins & conf deposits if it had been changed...)
Blank page?!
Some PHP errors can cause a blank page on both the public and private parts of your site.
In this case, you must add the following code to The mes_options.php file:
// Enable PHP error reporting
error_reporting(E_ALL^E_NOTICE);
ini_set ("display_errors", "On");

// Display all errors in SPIP
define('SPIP_ERREUR_REPORT', E_ALL);
...then restart your page. It should then display a PHP error message indicating the exact cause of the problem.
Important : if this is a production site, you will have to delete these lines once the problem is solved.
Or, to simply log errors in /tmp/log/php.log without displaying them, add this to The mes_options.php file :
ini_set("log_errors", 1);
ini_set("error_log", $_SERVER['DOCUMENT_ROOT'] . '/tmp/log/php.log');
Obtaining even more information for debugging
Adding into config/mes_options.php:
| Constant Name | Values | Description |
|---|---|---|
| _NO_CACHE | -1,0,1 | Deactivate the cache |
| _INTERDIRE_COMPACTE_HEAD_ECRIRE | false,true | Deactivate CSS and Javascript caches |
| SPIP_ERREUR_REPORT | E_ALL | Display all errors in SPIP |
| $GLOBALS[’taille_des_logs’] | value in ko | Logs size |
| _MAX_LOG | number of lines | Limit logs size to n lines |
| _LOG_FILELINE | false,true | Add in the logs the file, the line and the name of the function from which the log is generated |
| _LOG_FILTRE_GRAVITE | 1 to 8 | Verbosity of the logs |
| _DEBUG_SLOW_QUERIES | false/true | Log SQL |
| _BOUCLE_PROFILER | value in ms | Follow the loops that require more than n ms |
define('_NO_CACHE', -1);
or by clicking on the button: "Temporarily deactivate the cache"
- Deactivate CSS and Javascript caches (files located inlocal/cache-js/ and local/cache-css/
define('_INTERDIRE_COMPACTE_HEAD_ECRIRE', true);
- Activate PHP error reporting
error_reporting(E_ALL^E_NOTICE);
ini_set ("display_errors", "On");
- Display all errors in SPIP
define('SPIP_ERREUR_REPORT',E_ALL);
- Increase log size to 500 KB
$GLOBALS['taille_des_logs'] = 500;
- Limit size logs to 500000 lines
define('_MAX_LOG', 500000);
- Add in the logs the file, the line and the name of the function from which the log is generated.
define('_LOG_FILELINE',true);
- Obtain all logs
define('_LOG_FILTRE_GRAVITE',8);
- Indicate in the MySQL logs (log/mysql-slow.log) the URL corresponding to the "slow" requests:
define('_DEBUG_SLOW_QUERIES', true);
- Follow loops that require more than 5 seconds (5000 ms) to execute
define('_BOUCLE_PROFILER', 5000);
To summarize to use ONLY on a site in DEVELOPMENT, you can copy / paste all this into your config/mes_options.php :
<?php
define('_NO_CACHE', -1);
define('_INTERDIRE_COMPACTE_HEAD_ECRIRE', true);
error_reporting(E_ALL^E_NOTICE);
ini_set ("display_errors", "On");
define('SPIP_ERREUR_REPORT',E_ALL);
$GLOBALS['taille_des_logs'] = 500;
define('_MAX_LOG', 500000);
define('_LOG_FILELINE',true);
define('_LOG_FILTRE_GRAVITE',8);
define('_DEBUG_SLOW_QUERIES', true);
define('_BOUCLE_PROFILER', 5000);